
Introduction
Two years and 6 days ago, Rivian went public in one of the hottest IPOs of 2021. If you were “lucky” enough to get in at the $78 IPO price (as many Rivian pre-order customers did), you were sitting on a +29% return ($100.73/share) ... by the end of that day. By the end of the week, you were sitting on a +67% return ($129.95/share).
Then exactly 2 years ago today on November 16, 2021, Rivian hit an all-time high midday: $179.47/share. If you were “lucky” enough to get in at the IPO price and “lucky” enough to sell that very moment, you’d be walking away with a +130% return… in less than 1 week.
But let’s say you weren’t so lucky, and you were that guy that bought Mr. Lucky’s IPO shares at $179.47. If that was you and you’re reading this, I hope you’re doing OK. Because over the past 2 years your investment went from $179.47 to $16.54 (as of market close today): a +90% loss. And if it makes you feel any better, you’re certainly not the only one to buy above the IPO price: Rivian didn’t close below $78 until January 18, 2022; a full 70 days after their IPO.
That’s quite the fall from grace: but now that we’ve hit the 2-year mark, let’s take a look at what happened, what’s to come, and why I think Rivian went from the worst EV investment 2 years ago to the best EV investment today.
Let’s go back 2 years and take a look at what we knew then
By the end of Rivan’s IPO week, they had a whopping $127 billion market cap. This is a slightly misleading analysis that everyone seems to do with EV manufacturers (myself included), but just for fun, let’s compare this to the market cap of some other US-based automakers that same week for scale:
You might be wondering: how many vehicles did Rivian produce in 2021? The answer: 1,003 vehicles. Now it’s important to mention that their first truck (the R1T) didn’t roll off the production line until September 2021 (2 months pre-IPO), and their first delivery vehicle (the EDV) for Amazon didn’t roll off the production line until December 2021 (1-month post-IPO).
A Rivian investor at the time would likely claim that stock prices are forward-looking, and their valuation reflects the current state of the EV market, consumer demand for the R1T truck and R1S SUV, commercial demand for the EDV, production ramp-up/estimates, etc. And that Rivian investor would be absolutely right – at least about the “stock prices are forward-looking” part. To understand the rest (or as much of it as we can), we need to understand what’s happened since the IPO…
By the end of Rivan’s IPO week, they had a whopping $127 billion market cap. This is a slightly misleading analysis that everyone seems to do with EV manufacturers (myself included), but just for fun, let’s compare this to the market cap of some other US-based automakers that same week for scale:
- 63% higher than Ford’s ($77.9 billion), which produced 1,905,955 vehicles in 2021
- 38% higher than GM’s ($92.1 billion), which produced 2,218,228 vehicles in 2021
- 87% lower than Tesla’s ($1 trillion), which produced 936,222 vehicles in 2021
You might be wondering: how many vehicles did Rivian produce in 2021? The answer: 1,003 vehicles. Now it’s important to mention that their first truck (the R1T) didn’t roll off the production line until September 2021 (2 months pre-IPO), and their first delivery vehicle (the EDV) for Amazon didn’t roll off the production line until December 2021 (1-month post-IPO).
A Rivian investor at the time would likely claim that stock prices are forward-looking, and their valuation reflects the current state of the EV market, consumer demand for the R1T truck and R1S SUV, commercial demand for the EDV, production ramp-up/estimates, etc. And that Rivian investor would be absolutely right – at least about the “stock prices are forward-looking” part. To understand the rest (or as much of it as we can), we need to understand what’s happened since the IPO…
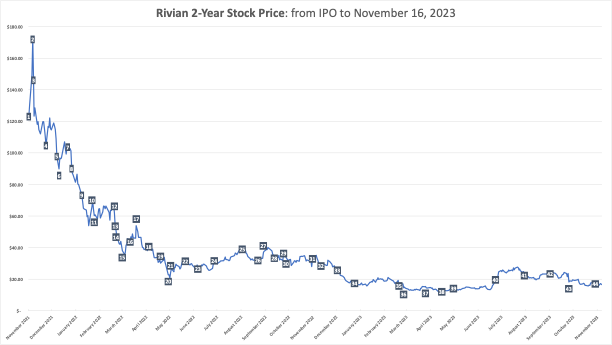
A detailed overview of events influencing Rivian’s share price over the past ~2 years:
(Hint: Numbering in the chart references the descriptions below, and vice-versa)
Selection of these events wasn’t overly-scientific, but it includes quarterly earnings releases, post-IPO lock-up period expiration, vehicle recalls, partnership changes, production announcements, financing announcements, and significant 1-day price swings.
Disclaimer:
Given the level of detail here, I’ve injected a dose of sarcasm to up the entertainment value.
I also attempted to put myself in the shoes of an early investor that bought near or above Rivian’s IPO price. I’ve done my best to color their imaginary thoughts in red.
- Rivian IPO’d at a sky-high valuation driven primarily by EV euphoria rather than serious investment analysis
- FOMO-driven speculators drove Rivian’s valuation even higher (“can’t miss out on the next Tesla!”)
- 1-week post-IPO, the slide begins. Smart investors/speculators recognize the post-IPO party is over and get out
- Less-than-smart investors/speculators hold and say “this is when I sold my Tesla investment… I’m not making that mistake again!” “Time to double-down!”
- Rivian misses their production target by ~200 vehicles on their first earnings report. “That’ll be a rounding error in 2 years” say the speculators/investors that stayed. “Over-correction… I’m buying more!”
- Stock price almost drops back to its IPO price as remaining investors [internally] start to question if they got it wrong
- “New year new me! I called this rebound” say investors as the stock closes above $100 on the first 2 trading days of 2022
- Amazon (an early Rivian investor and sole customer for Electric Delivery Vehicles) cheats on Rivian by becoming the first commercial customer for the Ram ProMaster EV
- “Uh oh” say investors as the stock closes below the $78 IPO price for the first time
- Samsung throws salt on the still-healing Amazon wound by choosing Stellantis (Dodge/Ram/Chrysler/Jeep parent company) over Rivian to be their battery factory partner
- Remaining investors are 1 out of 10 on the frustration scale, “but obviously there are going to be roadblocks” they say. 10% cut their losses and sell out.
- Rivian shocks the world (more specifically those that placed pre-orders for the R1S and R1T) with news their vehicle prices just went up ~20% because of pesky inflation and component costs
- Pre-order customers revolt (many of whom were allowed to buy stock at the IPO price through a special program). Frustration level climbs to 2 out of 10. An additional 10% (mostly those that cancelled pre-orders) cut their losses and sell out.
- Rivian realizes that it’s probably bad to upset their early adopters, and agrees to reinstate pre-order pricing for those that placed pre-orders before March 1. “We’re for sure losing money on those pre-orders” the CFO tells Rivian’s leadership team (privately)
- Q4 2021 earnings miss revenue estimates by 11% and EPS by 29%. This quarter never really mattered to serious investors, but news outlets nevertheless crank out “demise of Rivian”-type articles. Frustration level climbs to 3 out of 10. Another 10% cut their losses and sell out. Share price drops to half of its IPO price.
- Rivian spends the rest of the month mostly out of the limelight, appearing in sexy-but-not-important headlines such as “TIME 100 Most Influential Companies) and not-sexy-but-important headlines such as “Rivian Hires new COO to fix manufacturing” and “Georgia announces community meetings about planned Rivian manufacturing facility”
- The remaining 70% of early investors appreciate the calm as shares quietly climb back into the $50s by the end of March. “Glad I waited out the storm” they say.
- April is another slow news month for Rivian… kind of. In the absence of news directly related to Rivian are headlines about 2 of its earliest investors and current shareholders: Amazon and Ford. Rivian’s share price had declined so much that financial news is flooded with headlines like “Rivian Killed Ford Earnings. Now It’s Crushing Amazon’s”
- It’s the end of April and shares barely close above $30. “This isn’t fair!” exclaim the remaining 70% of early investors, “that’s an Amazon and Ford problem, not a Rivian problem” as their frustration level climbs to 4 out of 10. Another 10% cut their losses and sell out.
- Short sellers’ favorite day arrives: expiration of the post-IPO stock lock-up period. This means ~800 million shares are now without trading restrictions. Ford immediately announces that they plan to sell 8% of their ~100 million share holding. Frustration levels increase to 5 out of 10, if for no other reason than early investors not seeing this coming from a mile away. Another 10% cut their losses and sell out (50% remain, for those of you keeping track).
- Q1 2022 earnings miss revenue estimate by 28%, but investors are assured that demand remains high and production is on-track. Surprisingly, shares climb 18% from their previous close (Rivian’s largest 1-day % increase to date).
- Shares spend the rest of May climbing from the pre-earnings low around $20 to low $30s by the end of the month. Frustration levels remain steady for early investors (they’re still down +60% after all!), but hope (likely in the form of denial) prevails.
- June is another slow news month, with the biggest headlines coming from Elon Musk warning Rivian their priority should be solving financials “or they’re doomed”. Shares spend the month bouncing between ~$25 and ~$30.
- July brings back low-$30 share prices as Rivian confirms it’s on-track to build the 25k vehicles it promised at the beginning of the year. The rest of the month brings back “Rivian Killed Ford Earnings. Now It’s Crushing Amazon’s”-type headlines, but investors weren’t surprised this time. Shares continue to creep up to high-$30s at the beginning of August.
- Q2 2022 earnings beat revenue estimate by 9% and EPS estimate by 1%. “Finally, a revenue and EPS win!” exclaim early investors. But their frustration levels increase to 6 out of 10 as the market focuses on Rivian’s $1.7 billion cash burn over the quarter. Shares remain flat post-earnings.
- Shares quietly creep back to the low-$30s as another 10% of frustrated early investors, unable to cope with their 6 out of 10 frustration level, cut their losses and sell out.
- Some much-needed good news comes on September 8th as Rivian and Mercedes announce talks to make vans together in Europe. This “memorandum of understanding” was enough to propel Rivian’s stock price back above $40.
- Share prices slide over the next month as excitement about the Mercedes partnership is replaced with fear that Rivian’s incentive plan for their Georgia manufacturing facility is falling apart
- Georgia incentive fears are quickly replaced by Rivian’s October 4th announcement that Q3 set a record with over 7k vehicles produced. Investors cheer as shares close up 14%
- … but 1-week later, Rivian recalls over 12k vehicles due to a steering defect.
- Q3 2022 earnings narrowly miss revenue expectations, but Rivian’s cost-cutting measures get the limelight. Shares close up 17%.
- With few notable headlines, share prices slide back into the high-$20s. Frustration levels increase to 7 out of 10 as another 10% of early investors decide they can’t handle the rollercoaster of emotions and cash out.
- Just as share prices stabilize above a $25 floor, Rivian announces that they have paused talks with Mercedes on their Europe joint van factory. Shares rocket lower for the remainder of 2022, ending the year at $18.43.
- The slide continues into 2023 as Rivian announces 24,337 vehicles were produced in 2022, missing their 25k target by less than 3%. Early investors are numb, but too stubborn to cash out at prices this low.
- Q4 2022 earnings arrive with an 8% miss on revenue and 12% beat on EPS. But the big bummer is guidance: Wall Street expects 60k vehicles in 2023, but management expects 50k. The stock price slides 22% to $15.76. Even short sellers think $15 might be overkill: short interest hits an all-time low at ~35M shares
- One week after the 2023 production guidance disappointment, Rivian disappoints again by announcing plans to sell $1.3 billion in convertible notes. Share prices crater by 15%, largely driven by a near-doubling of short interest over that time period to ~69M shares.
- Less than 1 month later, Rivian disappoints again with Q1 production falling short of expectations. Management’s assurances that Rivian will still hit 50k in 2023 does little to calm investor panic.
- Shares close at an all-time low of $12 on April 25th. Short interest continues to climb throughout April with nearly 75M shares sold short.
- Q1 2023 earnings beat estimates by 23% and revenue meets estimates. Production guidance reaffirmed at 50k for the year. Shares barely budge after the mostly-positive earnings report.
- Rivian announces Q2 deliveries with 13,992 vehicles produced and 12,640 vehicles sold, exceeding analyst expectations of 11k vehicles. Shares jump 23% and close above $20.
- Q2 2023 earnings come in HOT with a 10% revenue beat and 24% EPS beat. 2023 production guidance increases to 52k. Early investors start dreaming of how they’ll spend their profits now that it will finally start climbing to the IPO price after a monster report. BUT WAIT: why is the stock dropping?! “If that earnings report didn’t impress then Rivian will NEVER go up!” Frustration levels increase to 8 out of 10 as another 10% of early investors cash out.
- With few major headlines, the rest of August and September bring a period of stability to Rivian’s stock as prices hover around the mid-$20s
- But then PURE PANIC hits… Rivian announces a $1.5 billion convertible note offering on October 4th. Frustration levels increase to “irate” (9 out of 10) as another 10% of early investors cash out. Short sellers smell blood. Short interest rockets from the relatively-stable ~85k it had been trading since the middle of the year to +105M by the end of October.
- Q3 2023 earnings come in HOT (once again!) with a 2% revenue beat, 11% EPS beat, 2023 production guidance increase to 54k, and end of EDV exclusivity deal with Amazon (opening EDV sales up to other commercial buyers). As icing on the cake, management also indicated the Georgia R2 facility is on-track, R1S/R1T demand remains high, EDV contribution margin is positive, and R1S/R1T contribution is expected to be positive by the end of 2023. Shares closed down 2% the following day. “Nope, I’m done” said the last 10% of early investors as their frustration level hit the maximum (10 out of 10), driving share prices down another 10% the following day to $15.33.
If you’re saying to yourself “well that was a sad story… it started with euphoria and ended with despondency… it feels like there’s no hope!”. Well, I agree with you, and I would add that this story is definitely not over. And based on my forward-looking analysis, I’ve come to the conclusion that the best is yet to come:

OK, so what’s next?
Let’s shift our thinking from the past to the present and future, taking a look at:
Disclaimer: my forward-looking portion of this analysis is incomplete. If readers find this information helpful, I will happily re-format the rest of my analysis and include it in a follow-up post. More details below.
Let’s shift our thinking from the past to the present and future, taking a look at:
- EV Demand (my POV on consumer and commercial EV demand)
- Financial Health and Performance Metrics (with a focus on those that tend to be the best predictor of future performance for high-growth companies)
- Product line expansion (and the new R2 facility in Georgia)
- Closing Thoughts (and what’s next)
Disclaimer: my forward-looking portion of this analysis is incomplete. If readers find this information helpful, I will happily re-format the rest of my analysis and include it in a follow-up post. More details below.
EV Demand Outlook
Over the past ~6 months, shares of EV manufacturers have collectively suffered (to various) as concerns around consumer EV demand have arisen. These concerns generally fall into 3 categories:
Despite current challenges, the market outlook for EVs remains strong. Currently, the sole driver is strong consumer demand. Over the next 10 years, the main driver is likely to shift towards regulation as the EU adopts legislation targeting zero carbon emissions from new vehicles by 2035. That’s not likely to happen in the US market, but the EPA recently increased its 2030 EV market share projections to 62%. There’s a lot of noise about EV demand. I’ll buy it when I see the evidence. I encourage you to do the same.
Additional analysis will be included in a follow-up post once I have a chance to format it for easier online viewing. It contains my analysis on investor sentiment and insider trading activity, inventory metrics, gross margin, operating margin, FCF, P/S ratio with industry comparisons, debt, burn rate (including future fundraising forecasts), the Georgia R2 manufacturing facility, short interest impact, a fun chart with an “IPO Day 1” race between Tesla and Rivian on share price, EV production, revenue, and expenses. Stay tuned!
Over the past ~6 months, shares of EV manufacturers have collectively suffered (to various) as concerns around consumer EV demand have arisen. These concerns generally fall into 3 categories:
- Mixed reports on EV Demand: Some reports suggest slowing consumer demand, while others indicate record sales and consistent growth. For example: US EV sales set another record in Q3 with total EV sales surpassing 300k for the first time; a ~50% increase YoY. After reading many of these reports, I’ve come to a more helpful conclusion than “reports are mixed”: clear winners and losers are emerging in the race to attract EV buyers. Companies like Tesla continue to attract with their tried-and-true product line and charging infrastructure, while companies like Lucid are seeing waning demand just as production was ramping up. As a result, investors are rightly questioning Lucid’s long-term survivability. Rivian is somewhere in-between, but I’d argue far closer to Tesla in the consumer demand arena. Consumer preference is inherently subjective, but it’s hard to argue with the practicality and appeal of the R1 platform for truck and SUV shoppers seeking an EV.
- High Prices and Affordability: This is a legitimate concern as the current R1 platform spec can exceed $100k after options. That’s a lot for a vehicle. What’s interesting is that the market didn’t seem to recognize this as a concern until interest rates continued rising throughout 2023. Though I have only anecdotal evidence from online message boards to support this, buyers of $100k vehicles tend to have more purchasing/financing options available to them compared to the average buyer of lower-priced EVs like the Tesla Model 3, Tesla Model Y, or Chevy Blazer EV. The recent inflation report seems to further allay rate-related fears as virtually every investment bank expects rates to decline throughout 2024.
- Automaker Responses: Automakers with non-EV options (GM and Ford) have adjusted their production and sales strategies in response to changing demand dynamics. The market has perceived this shift as a negative for EV-only makers such as Tesla and Rivian, but I’d argue the opposite: this will expand the capability gap between traditional automakers and EV-only companies. This happened in the late 1990s and early 2000s as US automakers responded to lower gas prices by shifting their focus away from smaller cars and towards SUVs. As gas prices skyrocketed, non-US manufacturer offerings like Toyota easily beat out that of Ford and GM. Fast forward to today and US automakers are still playing catch-up in that market.
Despite current challenges, the market outlook for EVs remains strong. Currently, the sole driver is strong consumer demand. Over the next 10 years, the main driver is likely to shift towards regulation as the EU adopts legislation targeting zero carbon emissions from new vehicles by 2035. That’s not likely to happen in the US market, but the EPA recently increased its 2030 EV market share projections to 62%. There’s a lot of noise about EV demand. I’ll buy it when I see the evidence. I encourage you to do the same.
Additional analysis will be included in a follow-up post once I have a chance to format it for easier online viewing. It contains my analysis on investor sentiment and insider trading activity, inventory metrics, gross margin, operating margin, FCF, P/S ratio with industry comparisons, debt, burn rate (including future fundraising forecasts), the Georgia R2 manufacturing facility, short interest impact, a fun chart with an “IPO Day 1” race between Tesla and Rivian on share price, EV production, revenue, and expenses. Stay tuned!
Closing Thoughts
Rivian’s journey thus far has been anything but smooth. The stock's tumultuous journey from its IPO highs to its current lows paints a stark picture of the volatility and uncertainty inherent in the EV market and high-growth companies more broadly. Yet, beneath this seemingly bleak narrative lies a story of resilience, innovation, and untapped potential.
Rivian's recent achievements – beating EPS estimates, raising production guidance, and significantly reducing production costs – are not just isolated successes; they are harbingers of a company learning, growing, and adapting in an incredibly competitive landscape. The key lies in seeing beyond the immediate fluctuations of stock price and focusing on the underlying value and long-term prospects of the company.
Rivian's unique position, straddling the consumer and commercial EV markets with vehicles like the R1T, R1S, and the EDV, gives it a competitive edge. Its ability to navigate supply chain complexities, ramp up production, and continuously improve its financial metrics indicates a company on the cusp of a significant turnaround.
Furthermore, the broader EV market context is changing. With increasing consumer awareness, regulatory pushes towards sustainability, and technological advancements, demand for EVs is poised to grow exponentially. In this evolving landscape, Rivian is uniquely positioned to capture a significant share of this market.
As investors and stock chart enthusiasts, it's crucial to adopt a panoramic view, looking beyond the myopic lens of short-term stock movements. The real story of Rivian, in my optimistic view, is just beginning to unfold. It's a narrative of a company poised to capitalize on a future where electric vehicles are the norm, not the exception. For those with a long-term perspective and a tolerance for the ebbs and flows of a nascent industry, Rivian presents not just a rebound story, but a growth story with the potential to redefine the EV landscape.
So, while the past two years may have been a rollercoaster, the tracks ahead for Rivian seem to lead upwards, towards new heights and uncharted territories. For the patient investor, the best is yet to come.


 RSS Feed