
"Everything seems to be going on sale today. Are you buying?"
Why the Market is Down Today
- US Industrial Output fell at its fastest rate in more than 18 months in April as factory production slumped
- Walmart (WMT) and Kohl’s (KSS) both released earnings – both below analyst estimates – both blamed the weather on their miss
- Fall in US Industrial output dampens hopes for a big jump in economic growth after a winter slowdown
- Markets are at or near all-time highs
- Momentum stocks have been hit hard (biotech/other healthcare, social media)
- China
- Possible nationwide property bubble is on the point of bursting
- So far this year, newly started construction projects fell over 22% compared with the same period last year
- Retail sales growth has slowed
- Much like the US real estate bubble, when prices stop rising (or in China’s case – now begin to fall), the effect can cause a snowball effect
- Chinese real estate, when coupled with related industries such as cement, steel, and other construction materials makes up about 16% of GDP (real estate alone is 13% - roughly double the US share at the height of the bubble in 2007)
- New applications for U.S. unemployment benefits hit a seven-year low last week while consumer prices recorded their largest increase in 10 months in April, pointing to a firmer economy
- Although the S&P 500 is currently holding at its 50-day moving average (it barely dropped below it earlier today), you only need to be concerned if it drops below (and stays below) its 100-day moving average (1st point of support) and the 150-day moving average (2nd point of support) – see chart below
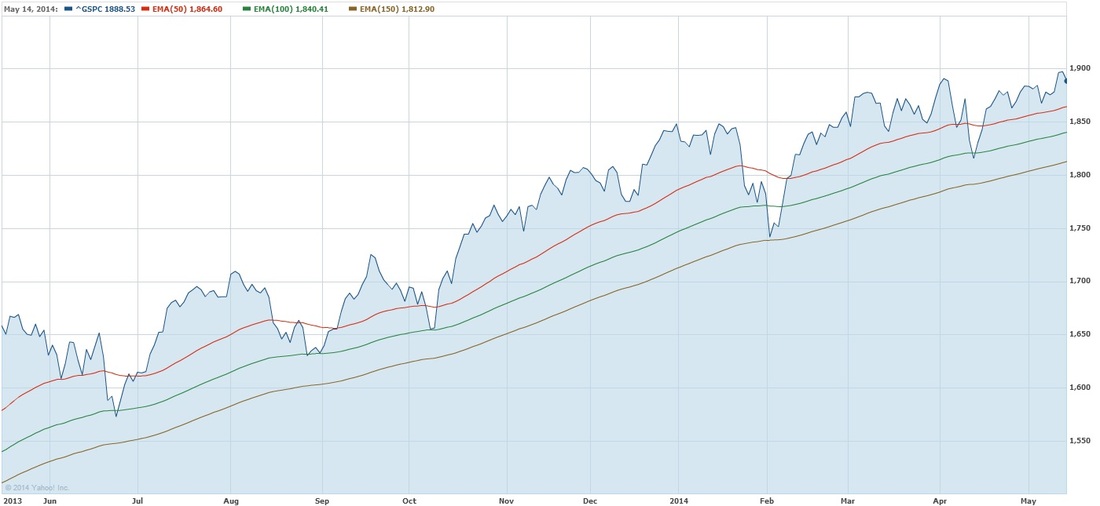
1-year chart of S&P 500 - note that index consistently holds at the 100-day moving average (green line), with one instance of dropping to the 150-day moving average (brown line)
- Also note in the above chart that the 50-day moving average provides absolutely no evidence of support or resistance over this 1-year period
- Keep in mind that markets have been mostly good the past 5-days and a steady increase throughout today may be likely
- Don’t buy yet, markets are just shy of all-time highs. Start buying at the 100-day moving average point and continue buying until it drops to the 150-day moving average
- Don’t worry about the US industrial production data as it is very cyclical and manufacturers may simply be compensating for overproduction from 2013 – only worry about China

 RSS Feed