ask@sargentcapital.com
Sargent Capital, LLC
  • Home
  • Blog
  • White Papers
  • Ask Us

Why do you need high-risk stocks when trading $INTC is as easy as this? (see chart)

6/12/2014

1 Comment

 
Picture
All too often, I receive emails asking about short-term trading strategies for extremely risky companies (see MedBox post below)... but what about blue-chip companies such as Intel?  Earlier this year I advocated buying Intel stock for a few different reasons:
  1. It is one of the great technology companies that grew with the popularity of the personal computer, but has since been hurt by "The Death of the Personal Computer"-type statements from prominent investors and analysts
  2. The Windows XP OS, released in 2001 has been an extremely popular platform for personal users, universities, retail banks, government institutions, and ATM operators.  This is due to its ease of use, security, and stability.  However, security support for Windows XP ended this April.  While most personal users and small/medium businesses have moved on to newer systems, about 90% of ATMs still use XP.  As ATM operators begin to upgrade to newer software (mostly Windows 7), they will also need to upgrade their hardware to the 2010s-era, not the 2000s-era hardware they currently run on with XP.  This is where Intel comes in.  According to Retail Banking Research in London, there are approximately 200,000 ATMs in the United States that still use XP.
  3. Although many banks have started to make the shift towards newer Windows systems, many have elected to pay Microsoft to continue producing security updates (most contracts are for 1 year).  In other words, the opportunity to ride the wave of hardware system updates is not over.
  4. Why Intel and not AMD or Microsoft?  Microsoft, while a great company, derives only 10% of its revenue from the Windows Operating system.  Most revenue comes from Microsoft Office and Windows Server.  Simply put, you need a big % change in OS revenue to make a significant dent in the overall price of Intel stock.  Furthermore, this news is most likely already built into the stock price.  Why Intel over AMD?  This comes down to company valuation and preference for ATM operators to go the Intel route.  AMD is already trading at a P/E ratio of 89.38 with a 1y forward P/E estimate of 18.65.  Intel's same numbers are 14.94 and 13.96, respectively.  As you can see, investors aren't expecting much growth from Intel.
  5. It has been easy to trade since late last year.  Barring regular company events such as dividend announcements and quarterly reports, Intel has been following a nearly perfect technical pattern since its 52-week low last August (see chart below).  Traders who buy near the bottom of the regression channel and sell near the top will have made a significant profit.  The regression channel runs from the August 2013 low to March 4th, 2014 (the first time I made the study) and haven't changed it yet.
Picture
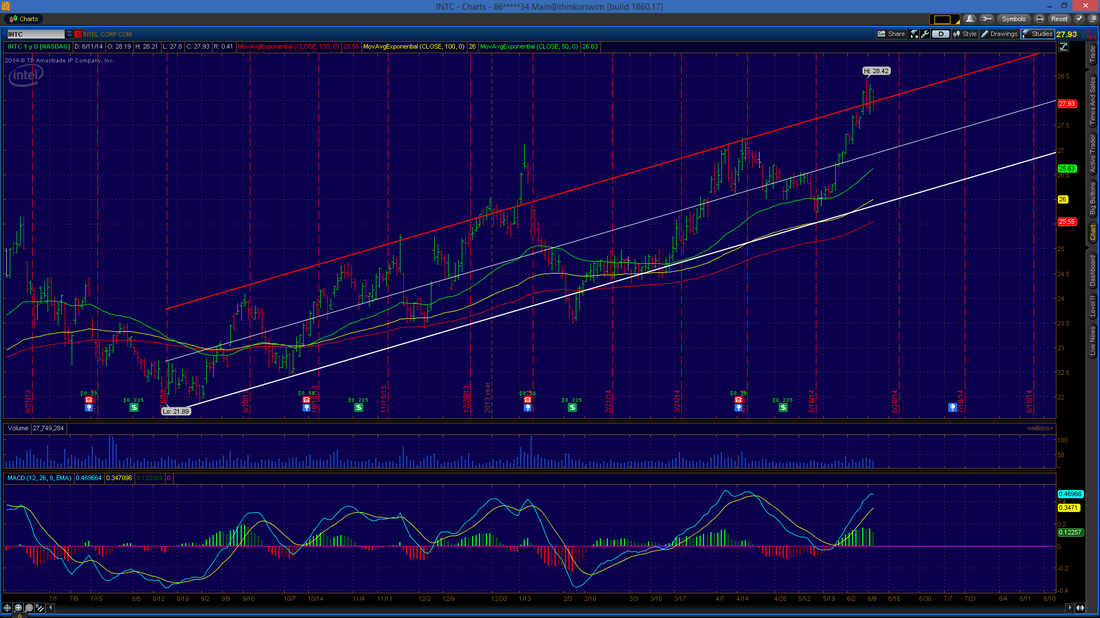
CLICK TO ENLARGE IMAGE
  6.    While the trend described in (5.) will certainly not go on forever, traders should find comfort            in knowing that Intel is a stable company and long-term prospects are encouraging.


So with a YTD return of over 8% versus less than 4% for the NASDAQ composite, is Intel still a great buy?  Yes.  With a low P/E ratio for the industry and reassuring growth prospects over the next 12- to 18-months, the price certainly doesn't match the potential.  Oh, and for all of you dividend buffs out there, it pays a hefty 3.30% yield.

Trader's Thoughts

Start buying around $27, but save some cash for if and when it drops below $26.50.
1 Comment

Universal Display Corporation $OLED - This year's biggest winner?

5/19/2014

0 Comments

 
Picture
"It seems like new cell phones are released every month with marginal improvements.  Furthermore, it appears that most new technologies are bought from small companies, not created by the big guys at Apple and Samsung.  What's going to be the newest mass-produced technology and from what company will it come?"
Introduction/Company Profile

Universal Display Corporation is engaged in the research, development and commercialization of organic, light emitting diode, or OLED, technologies and materials to display and lighting industries.  The company provides customized solutions to its clients and partners through technology transfer, collaborative technology development and on-site training.  The company had entered into more than 30 business agreements with leading manufacturers in Japan, Korea, Taiwan, China, Europe and the U.S. including with companies such as Chi Mei EL, DuPont Displays, Konica Minolta, LG Display, Samsung SMD, Seiko Epson, Sony, Tohoku Pioneer and Toyota Industries.  Universal Display was founded by Sherwin I. Seligsohn in April 1985 and is headquartered in Ewing, New Jersey.  Source: yCharts.com

Technology

The company’s core technology projects can be broken down into 4 categories: PHOLEDs, TOLEDs, FOLEDs, and WOLEDs (don’t worry… descriptions to come).  Perhaps the company’s most important product for near-term consumer electronics devices is their PHOLED, or Phosphorescent OLED technology.  A central theme in mobile electronics over the past few years has been minimizing the overall profile of the devices.  A fundamental roadblock to this theme has been the conflict between the growth in size of cell phone displays and the limited capacities of lithium-ion batteries.  PHOLED focuses on the former-half of this conundrum – reducing power consumption.  Universal Display’s PHOLED technology consumes about 150mW of power, versus about 325mW for a traditional LCD screen and about 375mW for an OLED screen (based on a 4” diagonal display).  Not only does this help with power efficiency (possibly allowing for a smaller battery), the reduced profile of the actual PHOLED screen will help electronics manufacturers continue the trend of thinner profiles.

Universal Display’s TOLED (transparent OLED) technology, which is still in early stages of design, provides the user with a screen that is nearly as clear as the glass or plastic substrate when powered off.  While this technology is certainly further off from mass-commercialization, it is reassuring to know that the company has more ammunition than its basic OLED technology.  A more appropriate solution to near-future consumer technologies (did someone say iWatch?) is the FOLED technology (the ‘F’ stands for “flexible”).  This is exactly what it sounds like – OLED technology on a flexible substrate.  As Google, Apple, and Samsung continue to tout their new “wearables”, there appears to be an apt suitor for their curved display challenge.

Finally, Universal Display’s WOLED technology (white OLED) is a product of the company’s PHOLED technology.  It provides an alternative to the standard incandescent and fluorescent bulbs, providing more than twice the power efficiency of an average fluorescent bulb.  The US Department of Energy initiated a program in 2000 to fund the research and development of inorganic LEDs and OLEDs as prospective next-generation lighting sources.  Since then, the company has gone from 20 lumens per watt to 102 lm/W (compared to 12 lm/W for incandescent and 40-70 lm/W for fluorescent).  Their goal is to reach 150 lumens per watt before fully licensing the technology.

Business Strategy

While initially skeptical of Universal Display’s use of the “design and license” business model, I’ve come to believe that it will work well for the foreseeable future.  There are two main reasons for this: First, the company has a whopping 125 employees worldwide.  This means that their strategic advantage lands squarely in the “designing only” realm, especially because many large electronics assemblers already retain the necessary infrastructure to efficiently mass produce the technology created by Universal Display.  The company gets its intellectual property from three sources: in-house, sponsored University research, and Motorola, Inc.  Universal Display’s more recent patents have come from in-house and company-sponsored University research, with the most recent patent from Motorola completed in early 2002.

Valuation/Company Fundamentals

From a revenue standpoint, the company is trading at valuations well below its 3-year average P/S ratio of 31.61 at its current level of 7.1.  While still an extremely rich valuation, its current price may present an attractive entry point, especially considering the company’s 1Q2014 performance and explosive revenue growth.  Although the company has provided positive accounting profits over the past 4 quarters, it has struggled to remained FCF positive in 4 of the past 8 quarters.  This has caused Universal Display to burn through over $100 million over the past 2 years, $35 million of which occurred in 1Q2014.  While most companies have discrepancies between accounting profits and FCF due to depreciation and prepaid expenses, Universal Display’s discrepancy comes from ballooning account receivable – up to $24.51 million from $10.53 million the same quarter last year.  Look for this number to stabilize in future quarters, or at least remain in-line with revenue growth.

Final Thoughts

Due to the company’s high reliance on intellectual property, it is generally unwise to use balance sheet accounting ratios for valuation because the market value for these patents is generally much higher than the intangibles listed.  Nevertheless, the company’s current ratio of 17.11 and Altman non-manufacturers z-score of 18.15 (TTM) show liquidity and solvency are not of concern.  Due to the stock’s higher volatility, it is hard to weigh any technical movements.  However, knowing the stock is near a 52-week low after a solid quarter with triple-digit YoY revenue growth, Universal Display’s sub-15 P/E ratio and current price of $25.82 present an attractive entry point to what could be one of this year’s biggest winners.  I wonder if any large technology firms looking for an acquisition are thinking the same thing…
0 Comments

Hecla Mining Research Report $HL

4/23/2014

0 Comments

 
Picture
"What are your thoughts on Hecla Mining (HL)? I bought it at $2.98 and I'm curious how long you feel I should hold it."
Introduction

The first thing you want to notice for Hecla Mining is its correlation to a specific index (this part is relatively obvious, but nevertheless important to the price performance of Hecla).  As seen by the price below, the stock (blue line) follows the prices of gold (orange line) and silver (red line) much more closely than the S&P 500 index (green line).  I would estimate that, at least in the short- to medium-term, 80-90% of Hecla’s price performance will be due to the price performance of gold and silver.  With inflation at historical lows and worldwide economic concerns dampening, the appeal of gold among investors is minimal.  The remainder of this report will follow the 10-20% of value that the company provides aside from the direct prices of gold and silver.
Picture
Revenue Estimates

Hecla’s company projected 2014 silver production is 9.5 to 10 million ounces and 180k ounces of gold.  This equates to between $185 million and $195 million in base silver revenue and over $231 million in base gold revenue (based on current market prices).  These numbers alone total between $416 and $426 in revenue.  However, the analyst-estimated total revenue for the current year (2014) is about $506 million.  This difference comes from what Hecla calls “by-product credits”.  Hecla (and other miners) realize by-product credits when they mine something they didn’t consider to be their primary target.  This can be copper, zinc, lead, or even gold.  They then deduct the sales value of the by-product from the cost of mining their primary target (in this case, silver), to get their cash cost of mining after by-product credits.  Because these by-products are commodities, their values (and in effect the company’s forward revenue estimates) can be computed with relative ease.  I calculated that the correlation coefficient (Pearson’s r) between the by-product credit and the average annual price of copper to be 0.77.  Knowing this (and that copper is the largest by-product of silver mining), we see that a significant portion of Hecla’s revenue will come from the price of copper.  Given copper’s YTD performance, that’s bad news for Hecla.

The Supply Chain

Picture
Source: IBIS World
Based on the chart above, the demand industries are flagging, the key economic drivers are unfavorable, and supply industry prices are increasing.  This is the picture any analyst will see when they look at Hecla or any similar gold/silver mining company.  So, given this information, is the company trading at attractive valuations to be considered a “cheap” buy?  Based on its 3-year average P/S ratio and current sales (revenue) per share of 1.19, the stock is trading at a 30% discount.  However, when compared to other companies within the same industry, Hecla trades at a significant premium.  The P/S ratios of Hecla and other companies within the industry diverged starting in May 2012.  However, the P/S ratios have begun to converge again starting at the beginning of last year, possibly suggesting diminished stock performance even with above-average earnings reports.
Picture
Conclusion/Suggestions

Hecla Mining Company’s YTD underperformance versus gold prices and slight outperformance versus silver prices gives a mixed message, especially when compared to other companies within the industry.  For short-term trading, it is best to buy HL when the stock is trading at a significant discount to the 3-month price performance of both gold and silver.  For longer-term investing, I recommend selling HL as its valuation continues to come back in-line with the industry average of paying about $1.50 for each dollar of sales (P/S ratio).  If you’re looking for exposure to the possible recovery of gold/silver miners, I would look to Barrick, Goldcorp or Newmont.  If you’re simply looking for exposure to the possible recovery of gold or silver, buy a gold or silver ETF (GLD or SLV, respectively).

Extra: See if you notice the error in the company's investor fact sheet
0 Comments

Medbox - The Vending Machine Drug Dealer

1/7/2014

0 Comments

 
Picture
"Medbox stock has skyrocketed into the New Year and I was hoping you could give me insight on to why that is and if it is a viable long-term investment holding.  Because it is a "marijuana" stock, I would assume most of its success its attributed to Colorado's new recreational use law.  What are your thoughts?"
Introduction

The Marijuana debate has officially tipped in favor of its users.  Starting on January 1st, 2014, Colorado residents were officially allowed to purchase up to one ounce of marijuana for recreational purposes.  And possibly most importantly – between the long lines at dispensaries, product shortages, and cold temperatures – the transition was incident free.  I, for one, have no interest in smoking the drug regardless of its legal status, but think it will be a fantastic source of tax revenue for the government (25%+ in Colorado) and great source of legal profits (which will be taken from violent drug cartels and gangs).  For the first time, Americans favor legalizing marijuana.  58% now say the drug should be legalized, with 39% saying it should remain illegal.  As long as this trend continues, public opinion will push the government to continue its acceptance of the drug, resulting in massive profits for dispensaries, growers, accessory-makers, and others involved in the industry.  From a “macro” perspective – marijuana is a high growth industry with lots of potential for massive returns over the next 5 to 7 years.

Volatility Concerns

The first thing that needs to be mentioned regarding Medbox, Inc. is that it is HUGELY volatile.  Over the last 18 months, the stock has been trading as high as $205 and as low as $2.  If the stock follows a trend similar to that of January 2013, it will pop then drop again.  In December 2012, the stock went from the low $20 range to a high of $98 on January 11th, only to return to the $20 to $30 for the rest of the year.  Recently, the stock continued its December 2012-like climb in December 2013, only to continue into the New Year.

The Company

Medbox essentially produces highly secure “vending machines” for the “alternative medicine industry”.  What makes the company’s core product (the “Medbox Machine”) confusing is that it is only intended to be used by the clinic employee/pharmacy/nurse as opposed to directly to the end-consumer.  I suppose I was expecting more of a Redbox-style user interaction than asking an employee to interact with the machine for me.  The company does not directly hold any patents (according to the website), but holds rights to 5 patents through an “affiliate entity” – a euphemism meaning they bought the licensing rights for these patents from a different company.  I think the company has potential in the long-term, but marijuana dispensaries that start up in recently legalized states will most likely focus their expenditures on building inventory – not high-cost vending machines.

How to Invest

This is a very thinly traded stock only available in the OTC markets (if you’re not familiar – OTC is everything that doesn’t trade on a major exchange – including penny stocks).  This means that it may be hard to buy or sell a large position in one day.  Based on the current share price and average 3-month trading volume, less than $1.7 million worth of shares change hands every day.  Compare that to over $6 billion for Apple and over $43 million for AutoNation (one of the smallest companies in the S&P 500).

Recommendation

In my opinion, this is a pure momentum play.  The money to be made here is in the very short-term (holding time should be measured in hours, not days).  This is a buy high, sell higher scenario.  If that’s your style, this is the opportunity for you.  I would recommend choosing a dollar amount that represents the maximum you could fathom losing.  Then invest twice that amount.  Don’t pay more than $50 a share for the company, and set a limit sell order around $75 to automatically sell your position at that price or higher.  I do not recommend holding onto it for more than a week, and definitely sell before they report earnings at the end of the month.

One Final Thought

An interview with the CEO of a company can either make or break my opinion of the stock.  There are many great companies with great CEOs that have performed extremely well in the market last year – Boeing’s McNerney, Berkshire’s Buffett, P&G’s Lafley, Goldman’s Blankfein, and Sprint’s Hesse to name a few.  I have seen all 5 of these CEOs speak and have been nothing but impressed with each: a clear vision for the company, implementing meaningful changes, a clear understanding of their business and where it is headed, etc.  I watched a few YouTube videos of Medbox’s CEO speak, and while he appears to know what he’s talking about, when he was questioned on the performance of Medbox, he appeared uneasy and began stuttering and started looking off the screen.  I suppose it’s important to note that OTC companies have much more laid-back reporting requirements than NASDAQ or NYSE components.  Maybe it’s just me, but I don’t trust the guy – especially when he tries to make it sound like they developed the patents when they simply license them from a different company.  However, the dependability and trustworthiness of a CEO is not really a factor when it comes to short-term momentum trading, so take this with a grain of salt.

0 Comments

Buying HollyFrontier (or any company) before an earnings report

11/5/2013

0 Comments

 
Picture
"I'm thinking of making a big play on HollyFrontier Corporation before their Q3 2013 earnings report on November 6th.  More than 5,700 November 48 call options were purchased on Friday, showing traders turning bullish on the company.  What are your thoughts?"
HollyFrontier vs. Peers

Two things I would like to point out before I get too in-depth with this analysis.  First of all, one of the most important inputs in the profitability of oil refiners is the price of oil.  As you can see from Figure 1, the price of oil during July 2013 to September 2013 (the quarter the company is reporting for) is the highest it has been all year.  This is certainly a good sign for HollyFrontier, as its profitability has fallen behind its peers in recent quarters.  Companies with shrinking margins tend to trade at higher price-to-sales ratios and lower price-to-earnings ratios than those of their peers.  This is reflected in the PE ratio of oil refiners, where HollyFrontier has the lowest ratio versus its peers (showing an underpricing in the company’s stock – see Figure 2), and is also reflected in the PS ratio, where HollyFrontier has the highest PS ratio versus its peers (showing an overpricing in the company’s stock – see Figure 3).  The downside to the company is that investors take into account the present value of all future cash flows when pricing a stock, and the price of crude oil has fell from over $110 per barrel in September to $93.39 today – not a good sign for the company’s bottom line for the 4Q2013 reporting.

Do Not Let Speculative Option Traders Deceive You

The second perspective that is important to mention is, historically, high option volume (whether it is puts or calls) does not indicate direction of a stock following its earnings report.  Two recent examples were Apple, Inc.’s quarterly earnings released last week that were preceded by high call option volume.  Before the report, the stock was trading at $529.88 versus $526.85 (keep in mind that the actual EPS of $8.26 was higher than analyst estimates of $7.96 – it was the outlook that was less than promising).  I have a feeling that HollyFrontier may follow this same trend – great returns for 3Q2013, but negative forward-looking prospects.  The second example is stock in Sprint Corporation.  The earnings report came in worse than expected based on subscriber losses throughout 3Q2013, but a positive outlook going forward.  This has propelled the stock from $6.70 before its 3Q3013 earnings release on October 30th to $7.20 today (a 7.24% increase).  It’s also important to note that put option volume in the week before its earnings release was over 3 times call option volume.

Summary

I certainly wouldn’t rule out HollyFrontier as a long-term acquisition, but I definitely wouldn’t use high call option volume as a core reasoning for purchasing stock in the company ahead of an earnings report.  The stock has seen virtually no net price change from the beginning of the year (-0.11%), while its PE and PS ratios have stayed mostly stable as well.  Two of HollyFrontier’s competitors underperformed analyst EPS estimates for 3Q2013 (Phillips 66 was 7.4% lower than expected and Western Refining, Inc. was 35.3% lower than expected).  None of the companies mentioned in the charts below increased more than 4% since the earnings release (Valero Energy Corporation increased less than 1% after its EPS for 3Q2013 came in 39% higher than analysts’ expectations.

Recommendation

I cannot make a recommendation on the short-term trading prospects of HollyFrontier.  There are multiple analysts who follow these stocks on a daily basis and are still only right 50% of the time on quarterly earnings.  However, with an impressive earnings yield (18.8%), FCF yield (19.32%), book to market ratio (0.7321), dividend yield (2.58%), and reasonable PS ratio (0.4204), this is a reasonable value pick that will perform as a long-term holding.

Picture
Figure 1 – YTD Crude Oil Spot Price
Picture
Figure 2 – YTD PE Ratio of Comparable Oil Refiners
Picture
Figure 3 – YTD PS Ratio of Comparable Oil Refiners
0 Comments

China Mobile and the iPhone

10/26/2013

2 Comments

 
Picture
"I purchased a large block of shares in China Mobile before Apple's most recent Worldwide Developers Conference (WWDC) anticipating that the iPhone would finally be released on the world's largest telecommunications network.  After this did not happen, UBS downgraded the stock to a sell citing the Chinese government's redistribution of company profits to other carriers and poor management.  If you had a significant play in the stock, would you hold the stock and look for a bump, or dump it and cut your losses?"
Redistributing profits from one company’s income statement to another company’s income statement – an idea that could only be Made in China.  The weird way you have to think about China is that of one massive company which operates many subsidiaries.  All they are doing is shifting profits from one of their subsidiaries to another to create equality (or what they perceive as equality) – a core belief of socialist/communist principles.  That’s how I think of it, anyways, but I’m sure it is much more complicated.  Since you mentioned that your intent was to profit from an iPhone adoption on the network, I will focus my analysis on the short-term view of the company.

Cell Phone Carriers – US versus China

The major difference between cell phone buyers in the United States and those in the rest of the world is how the phone is purchased and/or financed.  In the United States, we buy a 16GB iPhone 5s for $199, then spend the next 2 years paying a hiked-up monthly service fee that helps to cover the remaining cost of the iPhone’s actual $649 price tag.  In the rest of the world, including China, buyers have to shell out the $649 ($549 in the case of the “cheap” iPhone 5c) at initial purchase.  That is no small investment, especially for a country with an average monthly income of less than $1,000 in its capital city (much lower for the whole country).

iPhone/3G Smartphone Adoption on China Mobile Network

I’m curious as to why you would choose to invest in China Mobile to profit from an iPhone announcement as opposed to investing in Apple.  I would think that Apple has more to benefit from selling new iPhones to China’s largest carrier than China Mobile has from more monthly subscription payments.  Nevertheless, the issue with China as a whole is that only 13% of mobile subscribers use 3G service – most likely due to the aforementioned price premium of purchasing a 3G enabled phone (smartphone).  China Mobile has been adding approximately 3 million 3G users per month over the last year, with 22% of total users utilizing 3G (169.5 million out of 755.2 million total users).  While that certainly presents a growth opportunity, the country’s standards of living and supply of low-cost smartphones will dictate how much users are willing to spend on these higher-priced services going forward.

Directly addressing the iPhone/China Mobile adoption, I personally think that the iPhone will be released on the network sometime this year or early next year.  There is a rumored November 11th release of the iPhone on China Mobile (keyword: rumored).  It is only a matter of time before the iPhone is released on China Mobile’s network, and I would be surprised if (at the very latest) it is released more than a month after rolling out its new 4G service.

Summary

One of the main reasons China Mobile reported a significant drop in profit for Q3 was higher costs associated with building the 4G network and expanding the 3G network.  If I trusted the Chinese government and China Mobile’s leadership, I would not be concerned as an investor in the company.  Despite lower profit for Q3 due to higher costs associated with network investment, the company continues to report higher subscriber growth, higher revenues, and higher percentages of customers utilizing 3G.  However, the fact that this company operates out of a communist regime seems to weigh heavily on the stock price.  If a company of similar size, growth rate, and dividend yield were offered in the United States, I estimate it would trade in the $127 to $153 range (based on industry average P/E ratios and considering the same number of shares outstanding).

Recommendation

Hold until rumored release date and reassess position on November 11th.  You have fundamentals in your favor, but technical indicators working against you.  Look for price support around the low $51 mark.  I don’t think you will recoup all of your losses in the short-term, but there is opportunity for some price appreciation.  Definitely more upside than downside at this price.

Other things to keep in mind:

China Mobile is an American Depositary Receipt (ADR) meaning a U.S. bank purchases shares in a foreign company (in the company’s domestic currency) and then gives you a fixed number of shares in the company.  There is nothing inherently wrong with this, but it adds, among other things, certain macroeconomic variables including currency risk.  Because of this currency risk, ADRs will be disproportionately negatively affected should the Federal Reserve decide to taper their QE program in the coming months.  This is because QE (since they are essentially “printing” money) causes inflation.  This means the price of China’s currency is appreciating (versus the US dollar) since the US has a higher inflation rate than that of China.  Based on current conditions, if the stock price of China Mobile were to remain the same in China’s currency, the value of China Mobile (an ADR) would increase due to the increasing value of the Chinese Yuan versus the US Dollar.  The opposite would take effect should the fed decide to taper.  Investors generally retreat from stocks at the end of the QE programs (which would cause the stock to go down), and the US inflation rate would most likely fall below the inflation rate of the Chinese Yuan, causing a disproportional drop in the China Mobile ADR versus a company that trades directly in US Dollars.

2 Comments

Should You Buy Voxeljet After +100% Gain on IPO?

10/19/2013

1 Comment

 
Picture
"I just read about a new 3D printing company that more than doubled on its IPO.  Is it a good investment?  What do you think of it relative to its competitors?"
First of all, it is important to note that, because Voxeljet AG is a company with less than $1.0 billion in revenues (as of December 31, 2013), the company qualifies as an “emerging growth company”.  This means that they don’t have to fully comply with the Sarbanes-Oxley Act nor do they have to present more than 2 years of audited financial statements.  To put things in perspective, the company had $11,486,000 in revenues last year, and is currently valued at $187,200,000.  The company’s revenues grew 52% from 2010 to 2011 and 20% from 2011 to 2012.  Not impressive considering 3D Systems (DDD) (the largest player in the industry) returned 44% from 2010 to 2011 and 53% from 2011 to 2012.  This shows shrinking revenue growth over the periods for Voxeljet, and growing revenue growth for 3D Systems.  Compared to most other 3D printer manufacturers, Voxeljet’s printers are extremely expensive, creating a long sales cycle due to internal assessments by customers before making a purchase.  While most other 3D printer manufacturers (3D Systems, Stratasys, Z Corporation) seem to be focusing on “how do I create a product that will be most useful to my customers”, Voxeljet seems to steer itself towards “how do I build a machine that will look most impressive on paper”.  I may be missing something, but there doesn’t seem to be much there that differentiates Voxeljet’s printers from those of the rest of the industry other than printer size and speed (two attributes that are relatively easy to replicate; especially for the firms with more resources).  This is an industry that is growing quickly, both in the share of the economy as well as the number of 3D printing companies.  Voxeljet, due to the aforementioned long sales cycle, will not experience explosive revenue growth.  If I were a purchasing manager for an automotive firm, I wouldn’t be itching to buy a capital-intensive, unproven machine from a relatively new company.  Their financial data from the first 6 months of this year (Jan 1st to June 20th, 2013) reflects this, showing a ~3.5% decline in revenue versus the same period in 2012.

On top of this, I generally don’t see IPOs as a good investment idea due to 1. The nature of an IPO and 2. The uncertainty of IPOs.  If you are a private company owner, and you believe that your company is on track to double profits every year for the next 5 years, are you going to take the company public right now?  Definitely not, because the company will be worth much more in 5 years when growth is slowing and outlook is not that great.  That is when companies have their IPO, after a great run and their owners want to cash in on the company’s growth.  900,000 of the 6,500,000 shares sold for the IPO were from previous owners cashing out their position.

I apologize if this analysis sounds overly pessimistic and biased towards the “DEFINITELY DON’T BUY” side, but I am generally skeptical of IPOs – especially ones that are so small that they are able to get past the reporting standards of larger companies (limiting what we can see), and long sales cycles (generally a catalyst for Enron-style mark-to-market accounting practices that inflate revenues in the short-term).

If you want to get into the 3D printer industry, go for one of the companies that had their IPO at least 3 years ago.  I like DDD and SSYS for these reasons.  These two companies capture 7.7% and 5.6% of the 3D printer manufacturing market share, respectively, and have more stable revenues, broader product offerings, and (perhaps most importantly), relatively realistic valuations.

I am generally interested investing if 2 criteria are met: 1. I like the stock (quantitative/valuation based – Is the company worth what they are asking for it?) and 2. I like the company (qualitative based – Would I want to own this company?).  For example, I LOVE Tesla (TSLA) as a company, but the valuation is so outlandish that I sent my professor a 4-page report (including graphics) on how ridiculous the company’s valuation is.  I am neither interested in Voxeljet’s stock nor its business.  Take a step back, watch the stock take a dive sometime over the next 2 years (like almost every single 3D IPO), then buy it cheap.

1 Comment

Is Tesla a Buy?

9/26/2013

1 Comment

 
Picture
"What are your thoughts on Tesla Motors?  The company's newest sedan recently received a perfect crash-test rating from Consumer Reports, and their sales have skyrocketed."
1.       Chrysler vs. Tesla – Market Capitalization and Sales
The Wall Street Journal reported Monday that Chrysler is filing for an IPO.  The UAW Heath Trust currently owns 41.5% of the company, with the remaining share owned by Italian car maker Fiat S.p.A.  The issue at hand is that Fiat wants to purchase the share of Chrysler that it does not already own.  However, UAW believes their share is worth $4.27 billion while Fiat believes UAW’s share is worth $1.75 billion.  While the most viable figure is most likely somewhere in the middle, this gives Chrysler a valuation somewhere in between $4.2 billion (based on Fiat’s measurements) and $10.3 billion (based on UAW’s measurements).  In the 12 months ended in June, Chrysler sold 2.3 million vehicles, compared to about 20,000 that Tesla produces in a year.  Tesla’s biggest bulls estimate that the company can sell 400,000 vehicles per year by year 2025.  Now I understand that a lot can change in the next 13 years, but Tesla is currently valued at $22 billion (between 2.14x and 5.24x Chrysler’s current valuation).

2.       Tesla’s Emerging Competition
The Wall Street Journal reported on September 16th that General Motors (GM) is developing an electric car that can go 200 miles on a charge for around $30,000.  This would be a huge hit to Tesla as their 3 major competitive advantages are: 1. Relatively low cost of electric vehicles, 2. Sportiness of electric vehicles, and 3. Safety of electric vehicles.  GM’s new electric vehicle (ETA TBA) would easily beat Tesla in the price category (estimated $30,000 vs. $63,570 with Federal Tax Credit).  The sportiness will be Tesla’s biggest competitive advantage, but faces upcoming product releases from BMW and Mercedes-Benz – both companies that are known to produce high-performance luxury vehicles.  Lastly, the safety benefits of the Tesla Model S are a result of the car being a fully electric vehicle as opposed to technical/mechanical inventions on Tesla’s part.  As a result of not needing a gasoline engine or advanced multi-gear drivetrain, electric cars have much more space for crumple zones and other safety features.

3.       Not a Level Playing Field (but soon will be with emerging competition)
As mentioned briefly in part (2), Tesla’s sales are partly fueled by tax subsidies (a benefit that larger car manufacturers will soon be able to enjoy).  This provides a $7,500 tax credit to anyone who purchases a zero emission vehicle.  In California, where most of Tesla’s cars are sold, the government provides an even larger $12,500 tax credit.

4.       Misleading Metrics
Tesla recently reported a 33,571% increase in California car sales, causing a more than threefold increase in Tesla’s stock price in less than 3 months.  This information, in conjunction with revenue growth, was reported in Tesla’s 1Q13 earnings report and 2Q13 earnings report (released 05/08/2013 and 08/07/2013, respectively).  These last two periods reported revenue quarterly YoY growth of 5,542.615% and 4,446.853%, respectively.  These two figures are the main driving forces behind the massive stock price increase this year.  Now let me tell you why they are EXTREMELY misleading: they didn’t even sell a car that was priced below $100,000 until less than a year ago!  They went from specialty (think Ferrari or Lamborghini) to mainstream electric – of course their reported revenue quarterly YoY growth is going to skyrocket during that transition.

5.       A Short Squeeze Has Caused Massive Technical Momentum (see figure 3)

Conclusion

Great company.  Good candidate for short term traders/speculators.  Bad candidate for long-term investors.

Sources: WSJ (where indicated), yCharts (fig. 1,2,3)
Picture
Figure 1 - Market Capitalization of Tesla, GM, and Ford
Picture
Figure 2 - Price-to-Sales ratios of Tesla, GM, and Ford
Picture
Figure 3 - Short Float vs Price of Tesla As you can see from this graph, a short squeeze in Tesla stock began around the beginning of March 2013. This same phenomenon occurred to car manufacturer Volkswagen in 2008 when a short squeeze temporarily drove the shares of the Volkswagen from 210.85 euros to over 1,000 euros in less than two days, briefly making it the most valuable company in the world. This short squeeze has caused massive technical momentum that has driven Tesla's stock price to an unsustainable valuation.
1 Comment
    Picture
    Click to check out our Twitter feed!

    Author

    Spencer Sargent

    Categories

    All
    Etfs
    Recommendations
    Stock Analysis
    Trading Strategies

    RSS Feed

Powered by Create your own unique website with customizable templates.